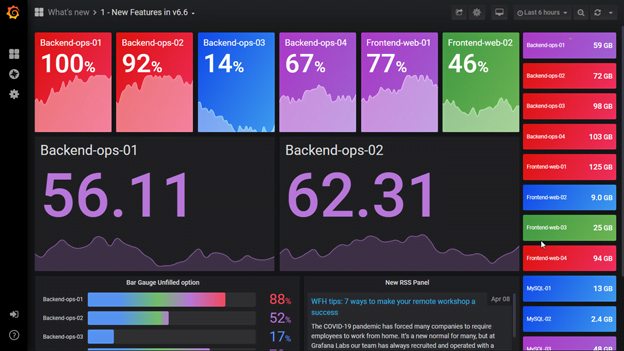
Ubuntu에 Grafana 설치 하기
Ubuntu 와 Grafana OS를 기준으로 Grafana 설치만 간략하게 정리 하였습니다.
1. Download & install
Grafana 최신 버전의 OSS를 패키지 정보 다운 받기
sudo apt-get install -y apt-transport-https
sudo apt-get install -y software-properties-common wget
wget -q -O - https://packages.grafana.com/gpg.key | sudo apt-key add -
안정버전의 레포지토리 추가 하기
echo "deb https://packages.grafana.com/oss/deb stable main" | sudo tee -a /etc/apt/sources.list.d/grafana.list레포지토리 설치 후 업데이트, grfana 설치
sudo apt-get update
sudo apt-get upgrade
sudo apt-get install grafana
2. Systemd에 등록하기
서버가 booting 하면서 바로 grfana가 시작 되도록 systemd에 등록한다.
sudo systemctl daemon-reload
sudo systemctl start grafana-server
sudo systemctl status grafana-server
sudo systemctl enable grafana-server.service
systemctl로 제어가 가능 하지만 binary로 별도로 실행하는 경우 아래와 같이 입력 하면 된다.
./bin/grafana-server webgrafana package가 설치된 정보는 아래아 같다.
installs binary to /usr/sbin/grafana-server
Installs Init.d script to /etc/init.d/grafana-server
Creates default file (environment vars) to /etc/default/grafana-server
Installs configuration file to /etc/grafana/grafana.ini
Installs systemd service (if systemd is available) name grafana-server.service
The default configuration sets the log file at /var/log/grafana/grafana.log
The default configuration specifies a SQLite3 db at /var/lib/grafana/grafana.db
Installs HTML/JS/CSS and other Grafana files at /usr/share/grafana
3. Grafana 시작하기
웹 브라우저에 Grafana를 설치한 IP 와 3000번 Port 번호를 입력하여 접속한다.
http://[Grfana 서버 IP]:3000
정상적으로 실행되고 있다면 아래와 같은 화면이 나타날 것이다.
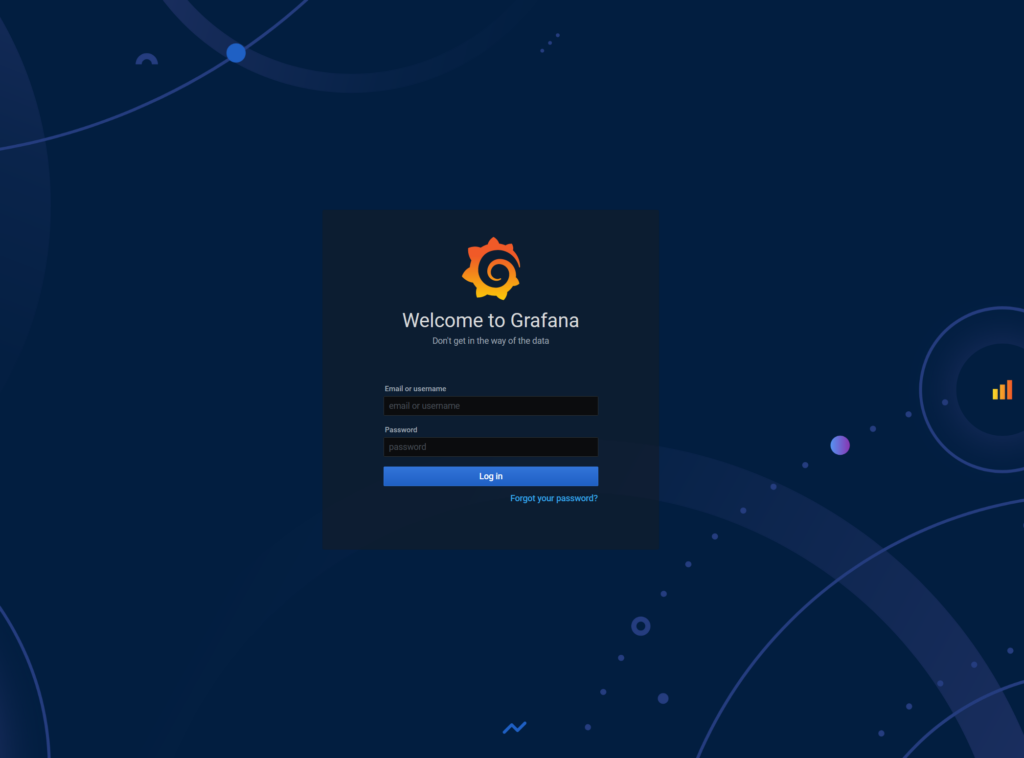
username 과 password에 모두 admin 이라고 입력하면 login이 되고 바로 password를 변경하는 화면이 된다. 변경한 password를 잘 기억 하도록 하자.
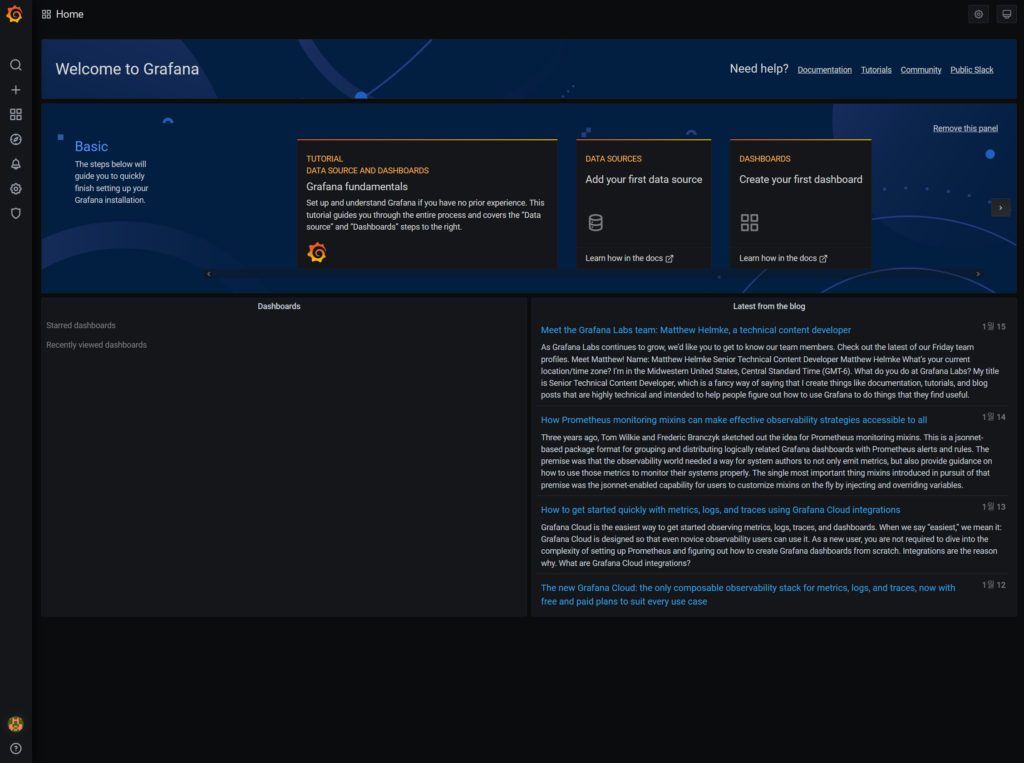
Login 하면 위와 같이 첫 화면이 등장 한다.
4. Dashboard 만들기
다음과 같은 순서로 Dashboad를 만든다.
- 왼쪽 판넬의 + 아이콘을 클릭하고 Create Dashboard -> Add new panel 선택
- 새로운 Dashboard의 편집 화면에서 Query tab이동
- query 항목을 클릭하고 나오는 List중 — Grafana –를 선택하고, data source 선택은 Random Walk dashboard로 설정
- 오른쪽 위의 Save 아이콘을 클릭하여 저장, Dashboard의 설명을 추가하고 다시한번 Save 한다.
아래 그림과같이 새로 구성한 Dashboard 와 Panel을 볼수 있다.
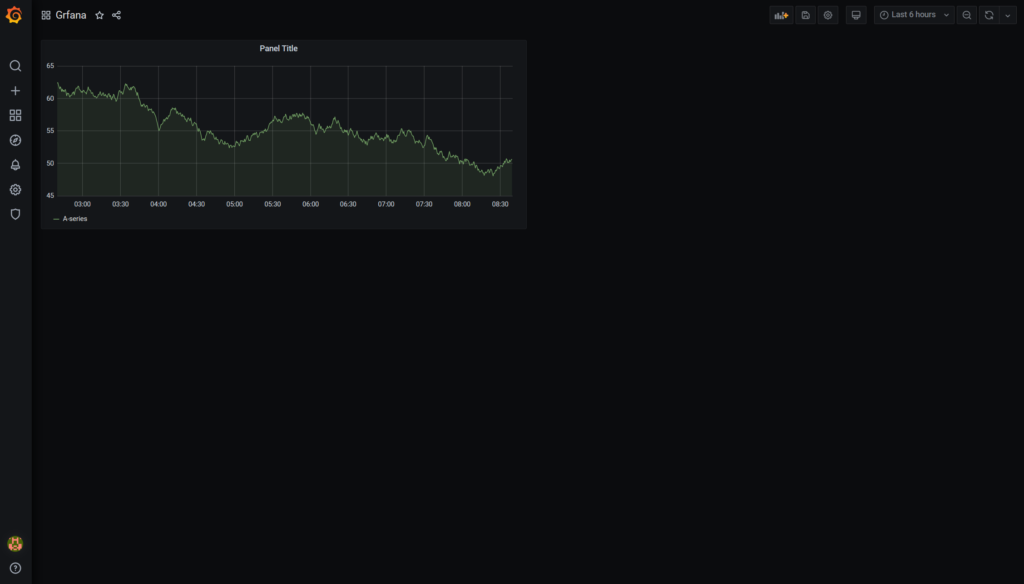
Grafana의 Panel은 Drag&Drop으로 이동과 배치를 Dashboard에서 자유롭게 할 수 있다.
Grafana는 데이터와 결과를 화면으로 시각적으로 보여주기 위한 도구 이다.
자체가 어떤 SMS나 NMS, APM이 아니다.
다양한 Data Sourcr 와 Plug-in, API 연동등을 이용해서 단순한 모니터링 부터 다양한 결과물을 만들수 있다.
그럼.. Grafana를 이용해서 Cloud를 모니터링 해보죠..